
Business intelligence (BI) and analytics have become increasingly important tools for businesses in today’s data-driven world. With the explosion of data, businesses need to harness the power of analytics to gain insights and make data-driven decisions. One popular tool for data visualization and analytics is Tableau Software.
Tableau Software is a business intelligence and data visualization tool that enables users to create interactive and visually appealing dashboards, reports, and charts. It allows businesses to connect to a variety of data sources, including spreadsheets, databases, and cloud services, to create meaningful insights and actionable data.
How Does Tableau Work?
Tableau is a data visualization and business intelligence software that allows users to connect to a wide variety of data sources, analyze data, and create interactive and visually appealing dashboards, reports, and charts. Here’s how Tableau works:
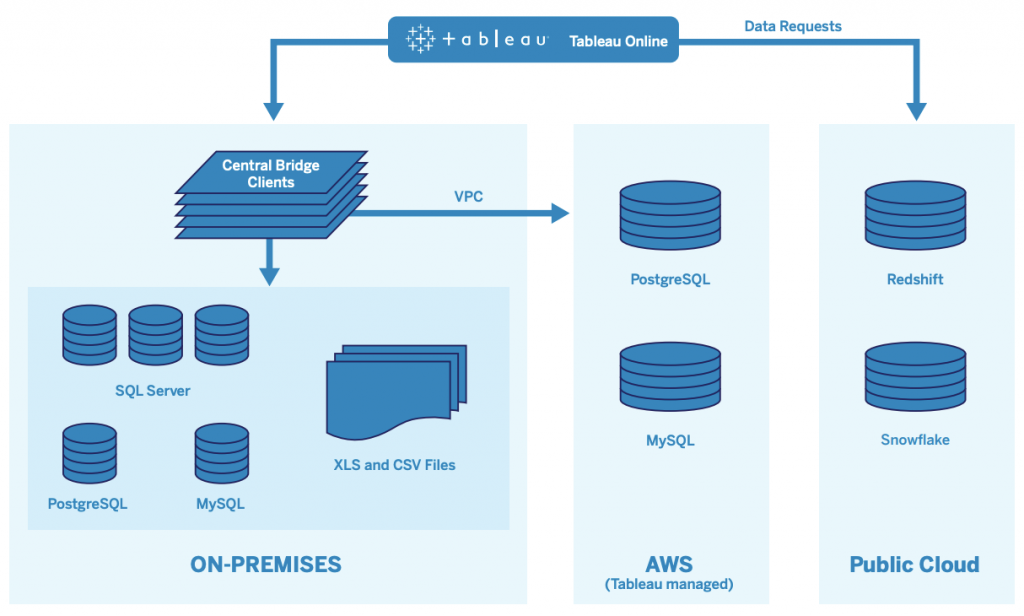
- Data Connection: The first step in using Tableau is to connect to the data source. Tableau can connect to a wide variety of data sources, including spreadsheets, databases, cloud services, and more. Users can connect to these data sources by selecting the appropriate data connector within Tableau.
- Data Preparation: Once connected to the data source, users can prepare the data for analysis. Tableau provides tools for cleaning and shaping the data, such as renaming columns, filtering data, and aggregating data.
- Data Analysis: With the data prepared, users can analyze the data using Tableau’s drag-and-drop interface. Users can create charts, graphs, and other visualizations to identify trends and patterns in the data. Tableau’s visualizations are highly customizable, allowing users to create unique and impactful dashboards and reports.
- Dashboard Creation: Once the analysis is complete, users can create interactive dashboards and reports that allow them to explore the data in more detail. Users can customize the dashboards with various charts, tables, and visualizations to present the data in a way that is easy to understand.
- Sharing and Collaboration: Finally, Tableau makes it easy to share and collaborate on data and visualizations. Users can share dashboards and reports with others, allowing for real-time collaboration and feedback.
Key Benefits of Tableau
One of the key benefits of Tableau Software is its ability to provide real-time analytics. Users can quickly and easily analyze data, identify trends, and make informed decisions based on real-time data. This is especially important for businesses that need to make quick decisions in a rapidly changing environment.
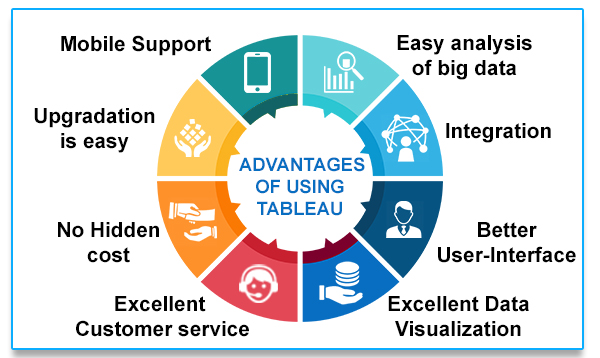
Another benefit of Tableau Software is its ease of use. The software’s intuitive drag-and-drop interface allows users to create complex visualizations without the need for coding or advanced technical skills. This makes it accessible to a wide range of users, including non-technical staff, which is crucial for businesses with limited technical resources.
Tableau Software also provides users with a variety of analytical tools, including predictive analytics, data blending, and data modeling. These tools enable users to identify patterns and trends in data, which can be used to make informed decisions and drive business growth.
In addition to its analytical capabilities, Tableau Software also provides users with powerful data visualization tools. The software’s visualizations are highly customizable, allowing users to create unique and impactful dashboards and reports. This makes it easier for users to present data in a meaningful way and communicate insights to stakeholders.
Applications and Uses of Tableau Software
Tableau Software is a powerful business intelligence and data visualization tool that has a wide range of applications and uses across industries. Here are some of the most common applications and uses of Tableau Software:
- Data Visualization: Tableau Software allows users to create interactive and visually appealing dashboards, charts, and reports. These visualizations help users quickly and easily identify patterns and trends in data.
- Business Intelligence: Tableau Software enables users to connect to a variety of data sources, including spreadsheets, databases, and cloud services, to create meaningful insights and actionable data. Users can analyze data, identify trends, and make informed decisions based on real-time data.
- Data Exploration: With Tableau Software, users can explore data in depth and gain insights that are not immediately visible. This helps users to better understand their data and uncover hidden patterns.
- Predictive Analytics: Tableau Software provides users with predictive analytics capabilities that enable them to forecast future trends based on historical data. This helps users to make informed decisions and plan for the future.
- Data Collaboration: Tableau Software makes it easy for users to collaborate on data and visualizations. Users can share dashboards and reports with others, allowing for real-time collaboration and feedback.
- Marketing Analytics: Tableau Software is a popular tool for marketing analytics, as it enables users to analyze customer behavior, track marketing campaigns, and identify areas for improvement.
- Sales Analytics: Tableau Software is also used for sales analytics, as it enables users to track sales performance, identify trends, and forecast future sales.
- Financial Analytics: Tableau Software is commonly used for financial analytics, as it allows users to analyze financial data, create financial models, and forecast future financial performance.
Conclusion
In conclusion, Tableau Software is a powerful business intelligence and analytics tool that provides users with real-time analytics, ease of use, and a variety of analytical and visualization tools. With the explosion of data in today’s business world, Tableau Software can help businesses harness the power of analytics to gain insights, make data-driven decisions, and drive business growth.